
Results
Viability in Organ Culture of Human Nonmelanoma Skin Cancer
We established organ cultures from tissue samples of 47 BCC and 11
SCC patients as described in Materials and methods. Cell death in the
tissue slices cultivated in organ culture was examined in histology
sections (5 μm) by staining with HE and by immune staining for activated
caspase-3 in sequential histological sections. Nodular BCC composites
of solid nests of basaloid cells (Fig. 1a, left panel) and SCC with some
atypical hyperchromatic nuclei (Fig. 1a, middle panel) were confirmed
by HE. Tissue levels of activated caspase-3 in BCC and SCC samples
immediately after surgical removal, as well as 24 and 72 h later, were
found to be similar (compare Fig. 1a at 0, 24 and 72 h). We noted the
presence of some apoptotic cells in the tissues immediately after
surgical removal but no significant increase in the first 3 days of
culture. In comparison, treatment of the tissues with cisplatin, a
well-known apoptosis inducer, resulted in extensive staining with
anticaspase-3 antibodies (Fig. 1a, right panel). Additionally, we show
stable mitochondrial dehydrogenase (MTT) enzyme specific activity,
indicating tissue viability during the first 3 days in organ culture
(Fig. 1b). These results indicate that the organ culture system provides
adequate conditions for the maintenance of BCC and SCC tissue slices ex vivo
for the duration of all subsequent experiments. No difference was
observed in the viability of different BCC subtypes (results not shown).
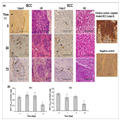
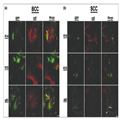
| Figure 1. Viability of nonmelanoma skin cancers in organ culture. Basal cell carcinoma (BCC) and squamous cell carcinoma (SCC) tissues were prepared for organ culture as described in Materials and methods and incubated for the indicated times. (a) Histological sections (4 μm) were stained with haematoxylin and eosin (HE). Immunohistochemical analyses of activated (cleaved) caspase-3 (Casp-3) were performed on sequential slices. For positive control, BCC slices were treated with cisplatin for 24 h before staining for caspase-3. Negative control slides were treated with phosphate-buffered saline instead of antibody to caspase-3. Bar = 100 μm. (b) Quantitative assessment of tissue viability was performed at different time points postculturing using the MTT assay.33 The absorbance (540 nm) of the formazan product indicates cell viability. The MTT values were normalized for protein content in the extract. Data reflect mean ± SD, n = 4; *P = 0·02. |
Tropism of Herpes Simplex Virus Type 1 in Basal Cell Carcinoma and Squamous Cell Carcinoma Tissues
We next explored tropism of viruses to the BCC and SCC tumours. The
viral vectors express reporter genes, GFP and β-gal. Results shown in
Figure 2 indicate that HSV-1 infects BCC and SCC tissues, targeting
areas at the perimeter of the tumour nodules (Fig. 2a, b). Quantitative
analyses of β-gal using the β-glo assay indicated that AD infected
equally well BCC and SCC tissues, while HSV-1 demonstrated a twofold
higher infectivity in SCC tissue as compared with BCC (Fig. 2c). No
difference was observed in the tropism of HSV-1 to the different BCC
subtypes (results not shown).
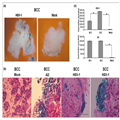
| Figure 2. Tropism of herpes simplex virus type 1 (HSV-1) and adenovirus (AD) to basal cell carcinoma (BCC) and squamous cell carcinoma (SCC) tissues. (a) Patterns of infection with HSV-1 vector: BCC slices were infected for 24 h with 2 × 10⁶ infectious units of HSV-1 or mock infected, and stained with X-gal. (b) Histological sections were prepared from HSV-1-infected BCC and SCC tissues and stained with X-gal and with haematoxylin and eosin. Bar = 100 μm. (c) Virus infection was analysed quantitatively for β-gal enzyme specific activity by the β-glo assay, as described in Materials and methods. Data reflect mean ± SD, n = 6 replicates taken from the same patient; *P < 0·05. Results are representative of three independent experiments. |
Herpes Simplex Virus Type 1 Induces Apoptosis following Infection of Basal Cell Carcinoma and Squamous Cell Carcinoma Tissues
The ability of HSV-1 to infect BCC and SCC tissues raised the
possibility of utilizing the virus to induce apoptosis in these tumours.
To examine this possibility we infected SCC and BCC slices in organ
cultures with HSV-1 for 1, 5 and 7 days, stained with X-gal to detect
the infected cells and prepared the tissues for HE staining and
immunohistology analysis with antibodies against activated caspase-3.
Figure 3a shows tissue destruction after 7 days as compared with
mock-infected tissues (Fig. 1 and data not shown for 7 days). In
particular, BCC cells infected by HSV-1 turned into empty shadows
(arrows) where the blue staining has already leaked out of the cells,
indicating extensive cytolysis induced by the virus. Staining with
antibodies to caspase-3 enabled us to examine apoptosis (brown-stained
cells) in relation to viral infection (blue cells). Figure 3b shows
intense caspase-3 staining, representing apoptotic cells following
infection.
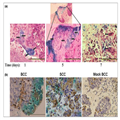
| Figure 3. Apoptosis is induced by herpes simplex virus type 1 (HSV-1) in basal cell carcinoma (BCC) and squamous cell carcinoma (SCC). (a) BCC tissues were infected in organ cultures as described in Materials and methods with HSV-1 (106 infectious units) for 1, 5 or 7 days, and stained with X-gal. Histological sections were prepared and stained with haematoxylin and eosin. Arrows point at empty shadows indicating extensive cytolysis. (b) BCC and SCC were infected with HSV-1, or mock infected with the same volume of phosphate-buffered saline, in organ cultures for 24 h and stained with X-gal. Histological sections were prepared and analysed by immunohistochemistry using antibodies to activated (cleaved) caspase-3 as a marker for apoptosis. Viral-infected cells are presented in blue-green; caspase-3-positive cells are stained in brown. Arrows point at apoptotic cells in close vicinity to the infected cells in the tissues. Bar = 100 μm. |
Herpes Simplex Virus Type 1 Infects a Specific Subpopulation of Early Progenitor Cells in the Basal Cell Carcinoma and Squamous Cell Carcinoma Tissues
To characterize the infected cells further, we used antibodies to
three epidermal differentiation markers: K14, p63 and K15.
Immunohistochemistry analysis was performed either with fixed tissue
sections (5 μm) or with whole-mount tissues (100-μm sections).
The analysis shows that viral infection (β-gal staining) was mostly
restricted to cells that express p63 (Fig. 4, arrows). In contrast, we
could not identify coexpression of β-gal reporter gene and K14 or K15 in
cells (Fig. 4). The immunohistochemistry methodology did not facilitate
an accurate determination of coexpression of the reporter gene and the
cellular marker in the same cell. Therefore, we used a whole-mount
immunoflorescence technique to identify virus infection by the reporter
GFP (green) and fluorescent-labelled antibodies against p63, K15 or K14
(red). In many of the infected cells p63 and virus GFP were colocalized
(yellow cells); no colocalization between K14 and K15 was observed (Fig.
5). These results suggest that the virus preferentially infects
progenitor keratinocytes, characterized by p63 expression.
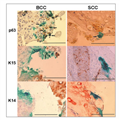
| Figure 4. Herpes simplex virus type 1 (HSV-1) colocalizes with p63 (arrows) but not with keratin 15 (K15) or keratin 14 (K14) markers in basal cell carcinoma (BCC) and squamous cell carcimona (SCC) infected cells (histological analysis). Tissues were infected in organ cultures as described in Materials and methods with HSV-1 (106 infectious units) for 24 h and stained with X-gal (blue-green). Histological sections were prepared and analysed by immunohistochemistry using antibodies to p63, K14 and K15 (brown). Bar = 100 μm. |
| Figure 5. Herpes simplex virus type 1 (HSV-1) colocalizes with p63 but not with keratin 14 (K14) or keratin 15 (K15) in (a) basal cell carcinoma (BCC) and (b) squamous cell carcinoma (SCC). BCC tissues in organ culture were infected with HSV-1 (106 infectious units mL−1) for 24 h as described in Materials and methods. Whole-mount tissues (100-μm slices) were fixed and stained with Cy5-conjugated antibodies to p63, K14 and K15. Images were collected using a confocal microscope. HSV-1 infection was detected by green fluorescent protein (GFP; green). The GFP signal (green) was merged with Cy5 signal (red) to determine colocalization (yellow; arrows) of the two colours and thus the virus and cell marker. Fluorescence background was determined in the mock-infected control tissue and subtracted from all the infected tissues. Bar = 200 μm. |
Basal Cell Carcinoma and Squamous Cell Carcinoma Tissues Express High Levels of ΔNp63 and TAp63 Isoforms
To evaluate further the abundance of p63 expression in BCC and SCC
tissues, before and after infection with HSV-1, we performed
quantitative real-time RT-PCR analyses using primers specific for the
two mRNA isoforms of p63, ΔNp63 and TAp63. Figure 6a and b shows that
BCC and SCC tissues taken immediately after surgery, before viral
infection, express relatively high levels of both isoforms. As p63+
cells are of low abundance in normal epidermis (Fig. 6a), we chose to
correlate the expression of p63 in BCC and SCC tissues to primary
culture of normal keratinocytes. After two passages in tissue culture,
the population of normal epidermal keratinocytes is enriched with the
early/progenitor cells.
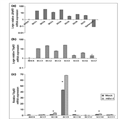
| Figure 6. Quantitative real-time reverse transcription–polymerase chain reaction (PCR) analysis of p63 isoforms. (a) Expression of ΔNp63 mRNA in three basal cell carcinoma (BCC), four squamous cell carcinoma (SCC) tumour tissues and a normal epidermis sample, as compared with the expression in normal human epidermal keratinocytes (NHEK). (b) Expression of TAp63 mRNA in three BCC and four SCC tumour tissues as compared with expression in NHEK. (c) Quantitative TAp63 mRNA expression in five BCC and two SCC samples 24 h after herpes simplex virus type 1 (HSV-1) infection (striped bars) compared with mock-infected samples (grey bars). Significant signals in real-time PCR fluorescent (Ct) for both p63 isoforms were normalized to a PCR fluorescent signal obtained from reference mRNA (GAPDH). Comparative and relative quantifications on gene products normalized to GAPDH were calculated by the 2−ΔΔCt method. Calibrator mRNA level (= 1) is NHEK. Data reflect mean ± SD, n = 3; *P < 0·05. |
The mRNA isoform ΔNp63 is expressed to a much higher degree (4–35
times) in NMSC than in normal human primary keratinocytes, while the
TAp63 isoform is expressed 2–26 times more in NMSC than in normal
keratinocytes. Furthermore, following infection with HSV-1, we detected
an increase of TAp63 isoform expression in three of five samples of BCC
tested; in two of these tissues a statistical significance was observed.
Two SCC tissue samples were tested for p63 expression and both showed
an increase in TAp63 expression in the HSV-1-infected tissues; in one of
them the increase was significant as compared with the same
mock-infected tissues (Fig. 6c). In contrast, no significant changes
were detected in ΔNp63 expression following HSV-1 infection of all the
BCC and SCC tissues tested. Furthermore, expression of ΔNp63 mRNA in the
tumour tissues was significantly higher than in normal keratinocytes
(data not shown).
No comments:
Post a Comment